ER diagram
Elements
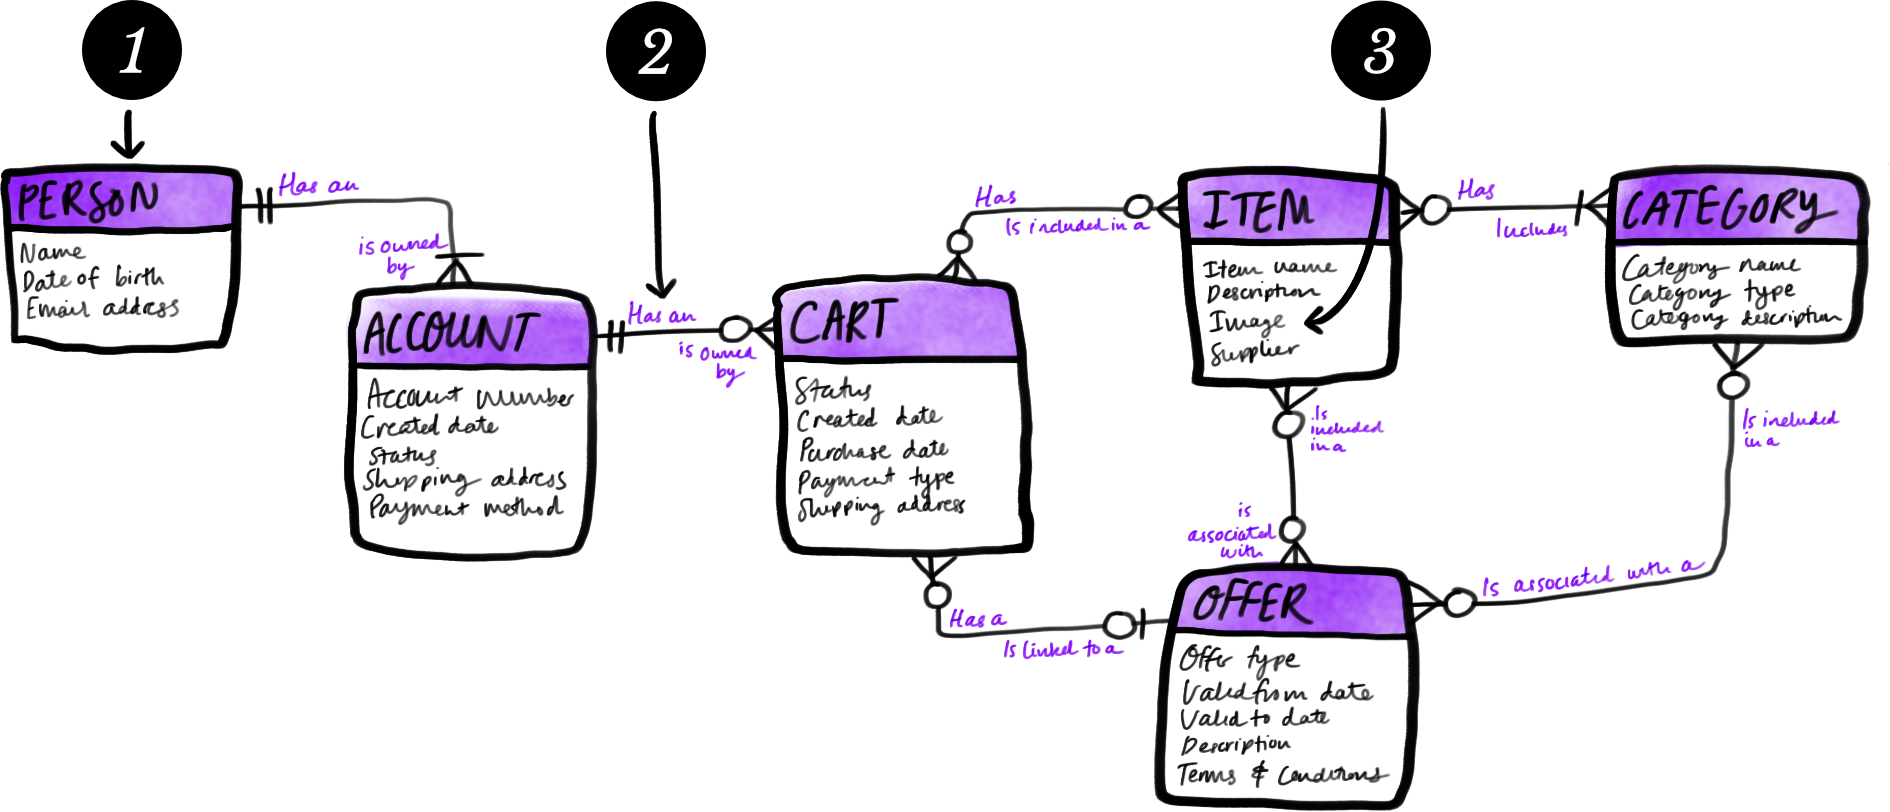
- Entity (thing): these are the objects with which your system is concerned. Not everything is an entity—only the important things are, for example, Person or Account.
- Relationship: an explanation of how one thing relates to another thing, e.g., is owned by.
- Attribute (characteristic): a property of a thing, such as name or account number.
What it is
The Entity Relationship Diagram (ER Diagram) is probably the most classic IT-related model type. It documents things (entities), how those things correlate (relationships), and the key things you’d want to know about the thing (attributes). The ER Diagram is traditionally used to model data and relationships between data for databases.
ER Diagrams are helpful because they are a simple way to represent your system’s entities visually and to ensure understanding across the team and the business. While there are several notation conventions for entity diagrams (the example diagram is using Crows Foot notation) all of them illustrate the same set of information about entities: entities, the relationships between them, and attributes of those entities.
When to use it
- Use an ER Diagram when your work will affect your data. To ensure that you don’t create unintended consequences, be clear on how your data is structured. This is especially important when making database changes.
- Use an ER Diagram when building a new database. ER Diagrams help you to understand how your things are related in real life, and therefore what you’ll need to record about them in a database.
How to use it
- Draw a box and label it with one of the things in your system—for example, “Person”.
- On another page, list out the important information you know about the thing—for our example: name, address, account, password and email address.
- Sort your list into two sets: things in their own right, or
characteristics of the listed thing. In our example name, address, email
are probably information associated with the person—i.e., attributes of
Person—but Account is important enough to be considered as its own thing.
- For each attribute you’ve identified, list them in the box under the title of the thing.
- For each new thing you’ve identified, draw another box and label it with the name of the new thing and join it to the existing box using a relationship line to show the connection. Add notation or words (or both) to the relationship lines to indicate the kind of relationship that exists (see the example above).
- Repeat steps 2-4 for each box you add until you run out of things in your system!
- Read your diagram out loud to make sure it makes sense: “a person has an account”, “an account has a password”, “accounts have carts”, “carts have one or more items”, etc. Refactor it until it’s as clear and complete as you can make it.
- As your diagram becomes more complex, shuffle your boxes to maintain visual sense and to keep closely related things together.
Rules for use
- Each entity must have a minimum of one relationship with another entity.
- Each end of a relationship must be labeled as one of the following:
- 0-to-1 (e.g, a cart can use no offers, or a maximum of one offer)
- 0-to-many (e.g., a cart can have any number of items, including none)
- 1-to-many (e.g., a person owns one or more accounts)
- 1-to-1 (e.g., an account must have exactly one owner)
Guidelines
- Not allowing zero means that the relationship is required and must exist
Tips & tricks
- The part of speech can help you to sort things out: Nouns are things (e.g., Person); verbs are relationships (e.g., owns). If you are using a noun such as “dog” or “person” or “house”, then it is most likely a thing. If you are using a verb such as “has” or “owns”, then you are most likely describing a relationship.
- Attributes usually only matter to a single entity.
- Stuck for words to describe your relationships? Some common relationship words include: has, have, owns, is owned by, includes, is included in.
- Don’t step on your data architect’s toes, or worse, make database design decisions without due consideration or the right expertise. Unless you are actually intending the diagram to be referenced as a database schema, make it clear that your model is a representation of your data, not of the database.
- Outsource! If your database already exists try a database schema rendering tool!
- Level your diagram. As you add more details you might want to promote some attributes to things and demote some things to attributes to make the diagram as a whole make sense.
- You can read aloud an entity’s attributes using ownership words, e.g., an account has a password, name, shipping address and payment methods.
Common issues
- Documenting a single instance of a thing as a thing. Entity Diagrams focus on types of things, not single examples of those things (e.g., “Dog” not “My dog Spot”)
- Assuming the map is the database layout. While any relational database will often mirror an Entity Relationship Diagram (if done well), the primary purpose of an ER Diagram is to provide clarity about entities, relationships, and attributes that the business cares about. A database will likely have all manner of rigmarole to support the software solution that wouldn’t be included in an ER Diagram. If in doubt, then talk to the technical peeps on your team!
- Inane abstraction. Not everything is it’s own thing. An ER Diagram is a model and, generally speaking, simpler is better.
Related methods
- State diagram: define your entity’s lifecycle.