State diagram
Define your entity's lifecycle
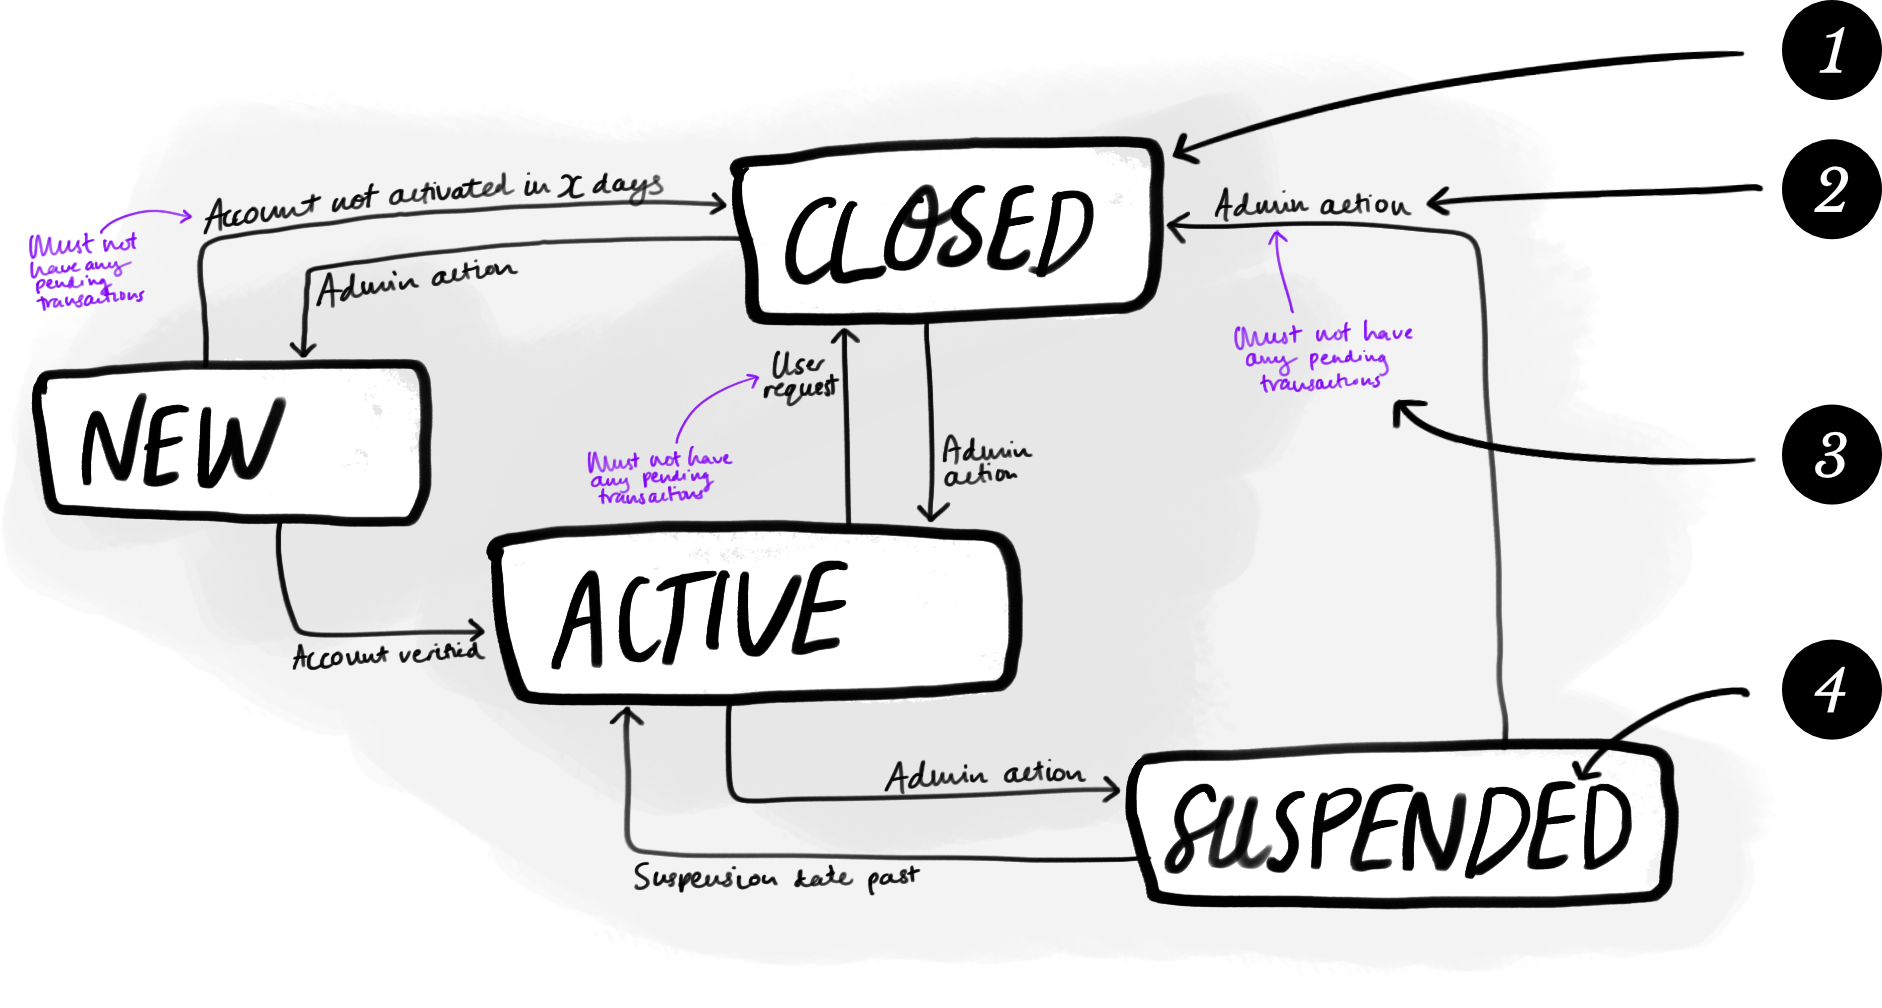
<p>A graphic illustration of a State diagram showing the fictional
states for an account.
The illustration contains 4 boxes. Each box has a title and annotated arrows
connecting it to the other boxes.</p><p>The first box is titled “New” and it has an arrow to the second box (titled “Active”).
The “New” box also has a line to the third box (titled “Closed”). The line from “New”
to “Closed” is annotated with the trigger “Account not activated in X days”.</p><p>The “Active” box has an arrow to the “Closed” box with the trigger “User request”.
The “Active” box also has an arrow to the forth box (titled “Suspended”) with the
trigger “Admin action”.</p><p>The “Closed” box has an arrow to the “New” box and an
arrow to the “Active” box. Both arrows are annotated with the trigger “Admin action”.</p><p>The “Suspended” box has an arrow to the “Active” box (with the trigger “Suspension date past”)
and an arrow to the “Closed” box (with the trigger “Admin action”).</p><p>Some of the arrows and triggers have further conditions noted. For example, the arrow from
“Active” to “Closed” with the trigger “User request” has the condition “Must not have any
pending transactions” recorded.</p>
Elements
- State: A condition an entity can be in, e.g., alive or dead.
- Transition: The action that causes the entity to change states. This can be triggered automatically or by user action.
- Transition condition: A condition that has to be met for an entity to transition to a new state. Not all transitions have conditions.
- Attribute: An aspect of a state that is important enough to call out on the diagram, e.g., reason for suspension. Use of attributes in your diagram is optional.
What it is
A State Diagram is a visual representation of an entity’s lifecycle. Get this right and you have gone a long way towards understanding your system’s data, views, and processes.
It is either one of the simplest things you’ll do on a project, which means the entities are well understood but not necessarily documented, or the hardest, which means that you are still in the process of establishing how the entities will work.
The State Diagram isn’t a typical BA method, but it really helps to identify both the different conditions that an entity can be in—the state of the entity—and the actions that impact that entity.
When to use it
- When creating a new system.
- When introducing a new feature or entity into a system.
- When making changes to how an entity is processed in a system.
How to use it
- Draw a box in the centre of your page. Label this box with the name of your active state. Often this will be Active, but you may also see Open, Published, Verified, etc.
- Draw another box. Label this box with the name of your inactive state. Often this will be Closed, but you may also see Inactive, Suspended, Terminated, etc.
- Draw boxes for any other states your entity can be in. Examples: Draft, New, Unverified, etc.
- Pick two boxes (we’ll refer to them as A and B).
- If the entity can transition directly from A to B, then
- draw an arrow from A to B,
- label the arrow with what triggers the change, and
- add any conditions to the transition.
- If the entity can transition directly from B to A, then
- draw an arrow from B to A,
- label the arrow with what triggers the change, and
- add any conditions to the transition.
- If the entity can transition directly from A to B, then
- Repeat step 4 for each pair of boxes, checking as you work that you haven’t missed any state changes, and that each box has at least one state change.
Rules for use
- Each state must have at least one transition.
- Each transition must have a direction.
- Each transition line must have a trigger.
Guidelines
- Transition conditions are optional.
Tips & tricks
- Stuck? Some common states are active, open, closed, suspended, new, unverified, verified, draft, published, inactive, and archived.
- Not sure about the trigger? Common trigger types include: user action (e.g., user closes their account), an event (e.g., order received), and manual (e.g., administrator marks account as suspended).
- Dead or alive. If your states don’t feel important enough to populate the status column in a report, you’re probably thinking too low level. You’ll be surprised how often a State Diagram is as simple as Active and Closed!
Common issues
- Too many states. If you find yourself with too many states, or state names like “Active Account with no orders” you’ve probably promoted attributes to state-hood. As a general rule, any characteristic that is relevant to two or more states should be an attribute instead.
- Keeping it too real. Since State Diagrams are most often used to help us understand how a system should treat data that represents an entity, they won’t always reflect reality. Unlike the real world, your software system will have to be able to recover from human error, e.g., “oh no—I accidentally marked this person as deceased!”
- Forgetting exception cases. Even though entities don’t usually move backwards through a lifecycle, a software system often needs to allow for exception cases (see above).
- Single use. A State Diagram is true only for the entity you created it for and not any other entity. For example the carts, store items, and collections in a shopping system will all have their own applicable state diagram.
Related methods
- ER diagram: visually represent your system’s entities.
- Process model: summarise a complex series of actions.