Value/Effort map
Work out what to work on next
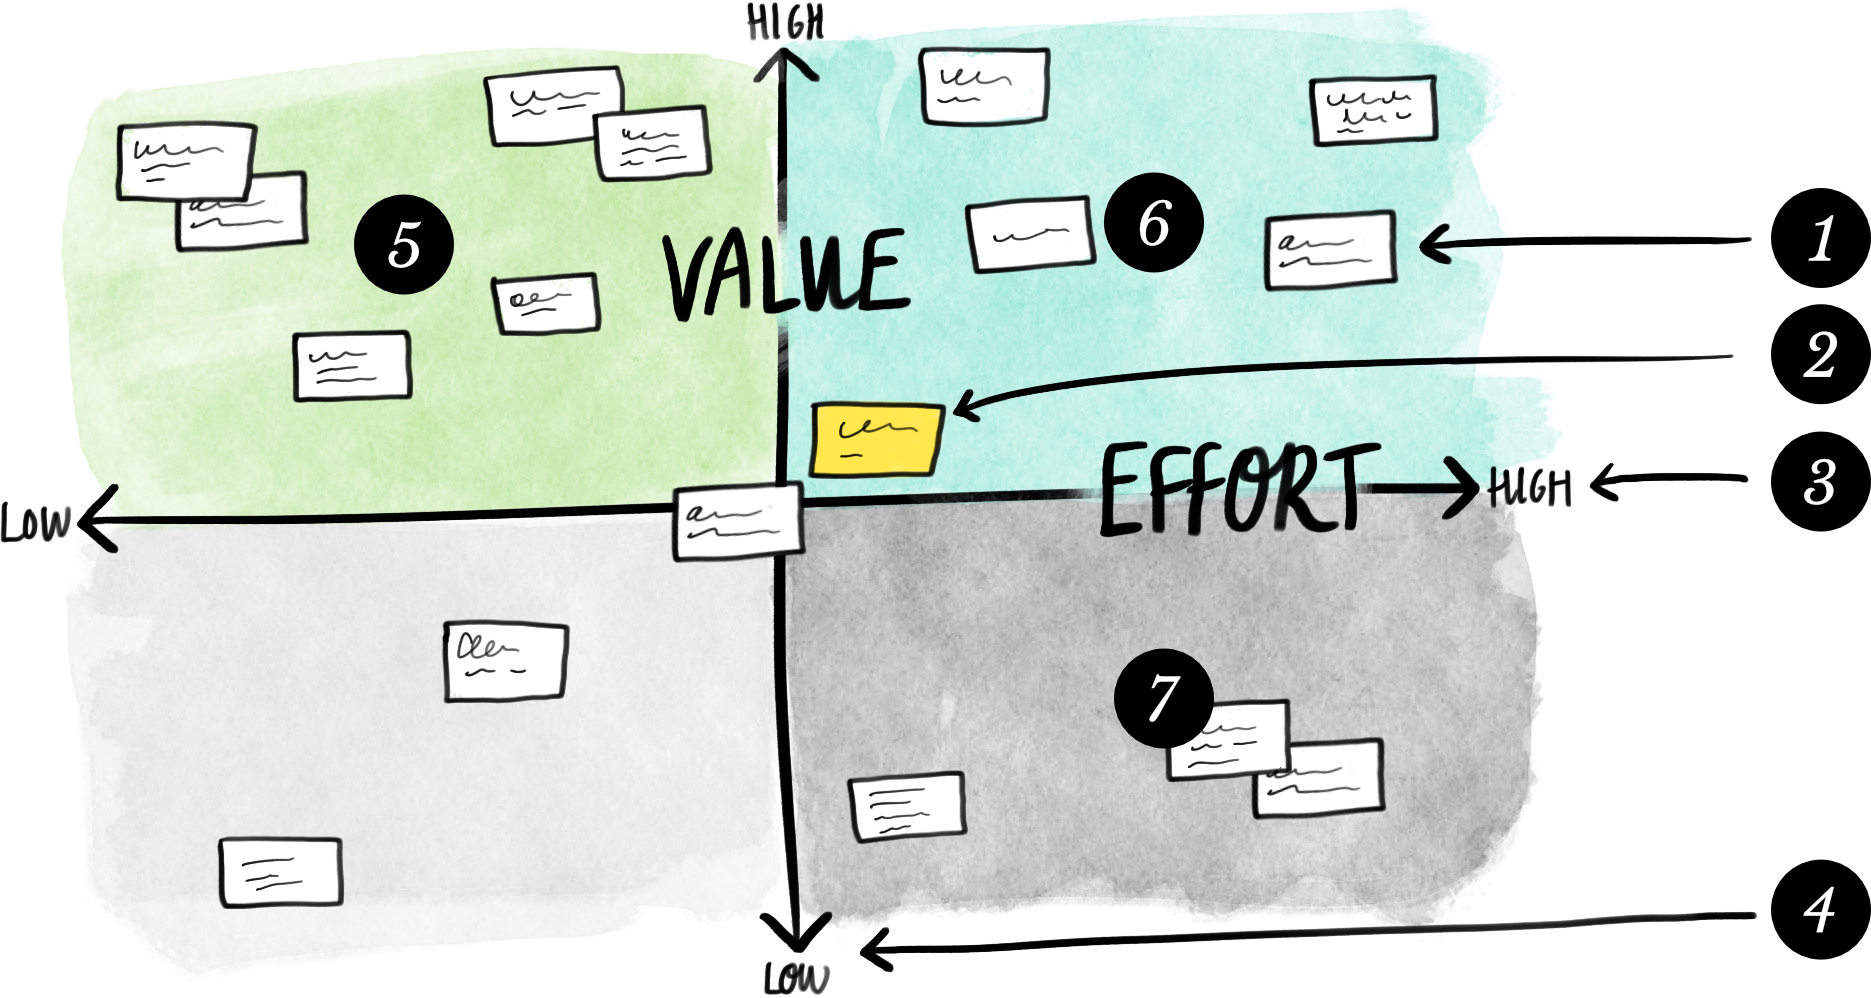
<p>A graphic illustration of a fictional Value/Effort Map.</p><p>The Value/Effort map has a vertical and a horizontal axis dividing the page into 4 quarters.
The vertical axis is titled “Value” and the top of the axis is labelled “High value”
and the bottom of the axis is labelled “Low value”.
The horizontal axis is titled “Effort” and the left of the axis is labelled “Low effort”
and the right of the axis is labelled “High effort”.</p><p>In each quarter there are cards.<br/>
In the centre of the map (approximately where the two axes cross) is a highlighted card.</p>
Elements
- Thing: a piece of work, activity, or task
- Anchor: a piece of work you and your team have recently completed which you can use to compare your items to. Anchors are best if they are recent, and medium-ish in terms of value and effort.
- Effort continuum: how much effort will it take to complete the work?
- Value continuum: how much overall value will result from the work?
- Quick-win-zone: Upper left: high value, low effort. These are the pieces of work that would deliver a huge amount of value, for very little effort. Do these first!
- Break-me-down zone: Upper right: high value, high effort. Pieces of work that will deliver huge value, but require huge effort. Best to break them down into smaller pieces of work.
- Not-worth-it zone: Lower right: low value, high effort. Pieces of work to be avoided as they don’t deliver enough value to make them worth it!
What it is
A Value-Effort Map is a method to work out what to work on next! It visually summarises pieces of work in terms of the value the work will deliver and the effort that is required to get the work done.
A Value-Effort Map is a great way to build a shared understanding between your business and technical peeps because it keeps the focus on value while ensuring the effort required is not forgotten. It also helps identify both the quick wins—high value for little effort—as well as those things that will require a lot of effort and commitment.
When to use it
- When you’ve got a lot of work to do, but are not sure what to work on.
How to use it
- Draw a horizontal axis on a whiteboard or a sheet of paper. Label it “low effort” (left) to “high effort” (right).
- Add a vertical axis. Label it “low value” (bottom) to “high value” (top).
- Create your anchors. Label a card with the name of a recent medium-ish piece of work that the team completed and put it on the map in a middle-ish location. Repeat for up to three anchors.
- Label a card with the name of a piece of work from your backlog:
- Discuss the value of the piece of work with your team and business representatives and where it should sit on the vertical value axis. Use the anchors to compare to make sure you’re being sensible.
- Then discuss the effort involved in delivering the piece of work with your team and where it should sit on the horizontal effort axis. Use the anchors as comparison to make sure you being sensible.
- Once you have consensus on both value and effort, pin the card to the board
- Repeat steps 4 and 5 for for each item on your backlog
- Once you have done your first cut, review the board: does any piece of work appear to be in the wrong place?
- Use the map to select what you should work on next!
Rules for use
- Only the team can estimate effort.
Guidelines
- A piece of work should be discrete (as far as possible).
- A piece of work should only appear once on the map.
Tips & tricks
- How much time do you have? Use the effort axis to find a piece of work that fits your team’s ability to commit.
- Stay anchored. Keep delivered items on the map as anchors to help keep everything relatively sized.
- Look for opportunities to break large pieces of work into smaller chunks. You’ll be surprised how often a smaller piece of work delivers almost all the value of the bigger piece, but for far less effort.
- An anchor is best explained by someone who worked on it. Get them to explain to the team what was involved—effort—and what it achieved—value.
- Keep ’em up to date. Perceived value tends to change over time and constant technology improvements will often render effort assessments incorrect. Periodically revisit your map to ensure validity.
- Unknown solution? Sometimes items are in the “break-me-down” zone because the team doesn’t know the solution yet. Try a time boxed investigation to see if the team can identify a solution. At worse, you’ll have some more information to enable further refinement.
- Keep the not-worth-it items on the map even if you’ll never work on them to make sure everyone remembers why you’re not doing them.
- If your backlog items are stored in a system use both the name of the piece of work and the system’s ID for it so you can easily find it later.
Common issues
- Business vs. development. While business representatives will often be more articulate regarding value, and the technical peeps will often be more articulate about effort, both can—and should—contribute to conversations about the other. Keeping the exercise collaborative builds shared understanding across this divide.
- Unbreakdownable work. Sometimes a piece of work just simply can’t be broken down. Try the nibble approach—whenever you have the opportunity—do a teeny-tiny piece of work that will help with the larger piece later. Keep going until the large piece is small enough to tackle. Failing that: Treat it as a project in its own right.
Related methods
- User story: describe user requirements by why, not what.
- Acceptance criteria: define a feature in yes or no terms.